Otto reporting on post-visit satisfaction enables data-driven decision-making, helps identify areas for improvement, enhances client loyalty, and contributes to the overall success and reputation of the clinic in a competitive market.
To get started with viewing data around surveys, navigate to Reporting on the left-hand menu and then click on Post Appointment Survey. Post-visit surveys can be configured by navigating to Survey in the left-hand menu.
NPS vs CSAT
Depending on your clinic's settings, the report will display either your average CSAT (Customer Satisfaction) score or your average NPS (Net Promoter Score). For a side-by-side of the two formats and how to choose between them, see Customer Satisfaction Surveys (CSAT and NPS) and Deciding on CSAT or NPS Surveys.
Score scales at a glance:
- CSAT: 1 (Poor) → 5 (Excellent)
- NPS: Detractors (0–6) → Passives (7–8) → Promoters (9–10)
Inside the Survey Report
💡 What counts as a response? The Post Appointment Survey report counts submitted responses with a score, not surveys sent or surveys started. If you compare this report to the System Health Dashboard, the System Health Dashboard counts surveys completed (sent), so totals will not match. To reconcile, use the Post Appointment Survey report for response volume and score distribution, and the System Health Dashboard for send and delivery volume.
Data can be filtered by date (and clinics - if there are multiple platforms in use) and can be downloaded as a PDF or printed by clicking on the top right arrow.
Within the reporting data, an average survey score will be displayed. Data collected will show the clinics average monthly survey results vs other Otto clinics.
The score distribution pie chart reveals a break down of individual scores. Clicking on the individual slices will reveal more information. Data can be downloaded by clicking the three dots in the right top corner.
A line graph shows the amount of the clinic's survey responses over the time frame chosen.
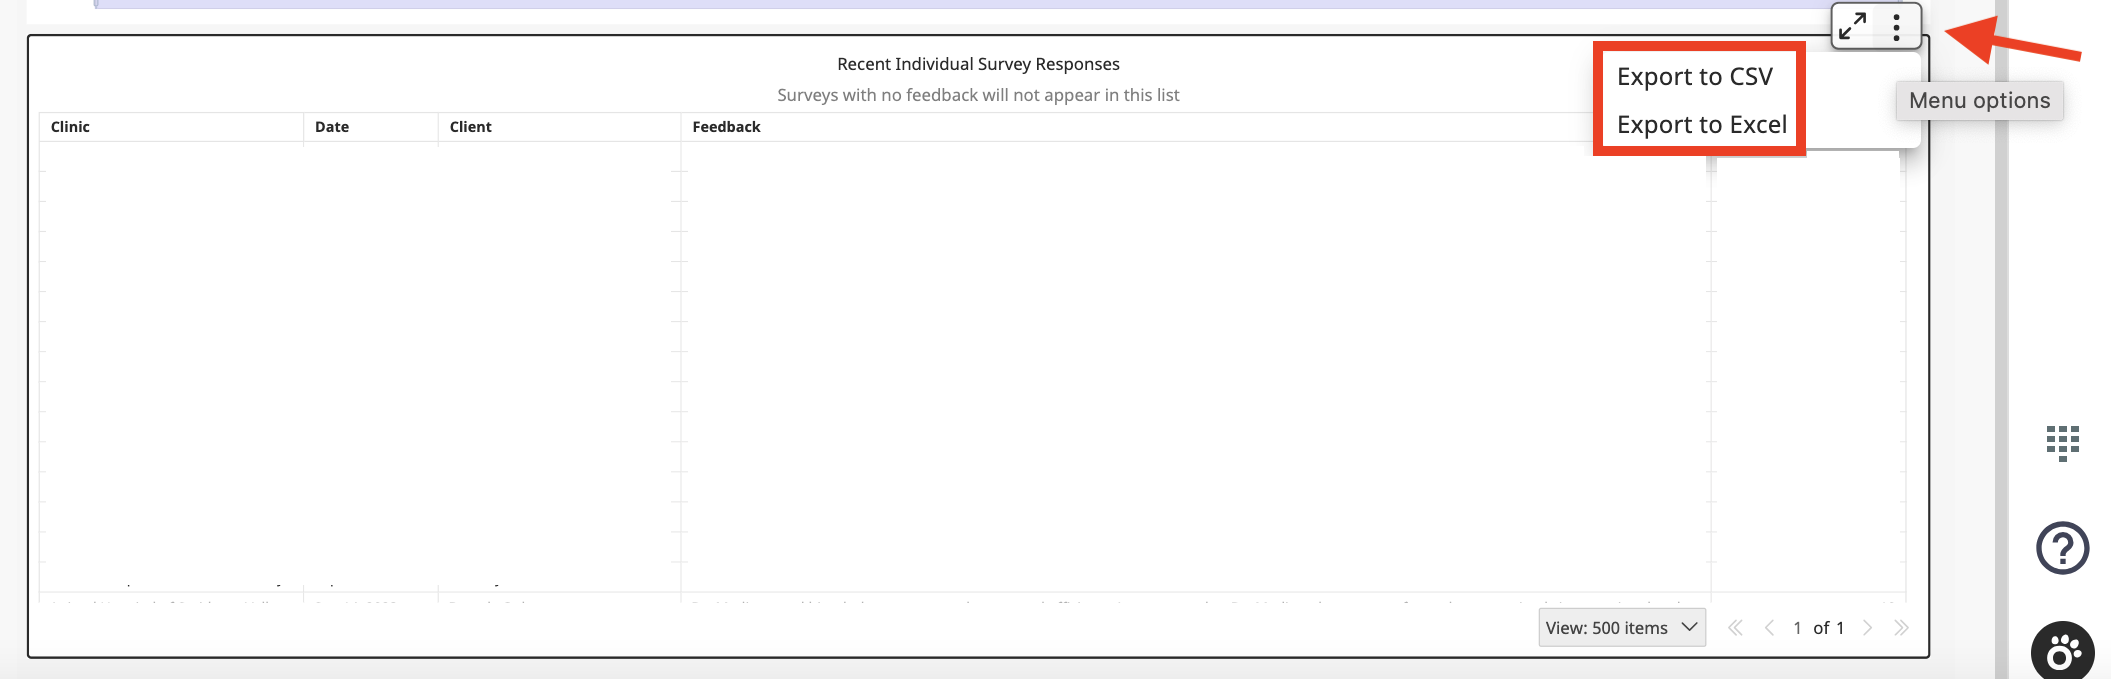
Recent individual survey responses will be available for viewing and download by clicking the three vertical dots in the right corner and choosing the download option.
Detail tab
The Detail tab shows each individual survey response with the client's name, score, follow-up answers, and the date the response was submitted. Email and phone columns are also included, so you can follow up with a detractor or thank a promoter without leaving the report.
To download responses, click the three vertical dots in the upper-right corner of the table.
Comments
0 comments
Please sign in to leave a comment.